Fetch data from any source, automatically. Build the emissions inventory without the spreadsheet. Model transition and physical risk with climate science behind it. Price the path to net zero. One platform, built for decisions — not just disclosures.
One tool for emissions. Another for risk. A consultant for scenarios. A spreadsheet for offsets. None of it talks to the others.
Invoices, meters, spend files, supplier emails — collected one by one, every cycle.
A scenario study done at commission, then treated as fact for years.
Exposure scored high, medium or low — rarely turned into a cost, or a next step.
The inventory, the risk model and the disclosure, redone from scratch, separately, every time.
Every climate obligation an organisation has, automated and connected — not four separate tools pretending to be one.
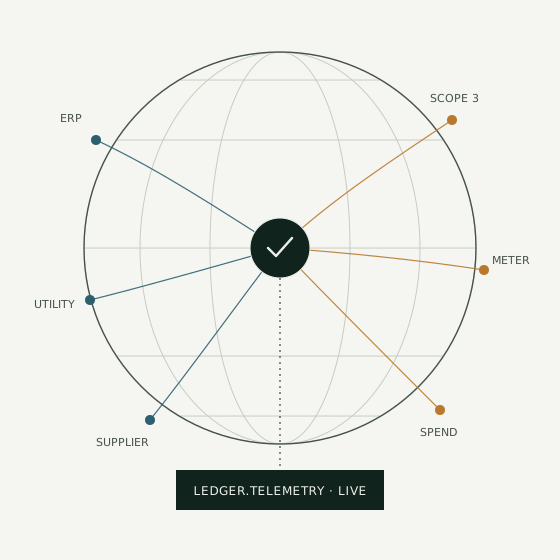
Agents fetch data from any source — ERP, utilities, spend, suppliers — automatically.
Every activity mapped, calculated and ledgered — scope 1, 2 and 3, always reconciled.
Transition and physical risk, and a priced route to net zero — built on real climate science.
Clear answers for the board, and filings assembled from the same live data.
Most tools do one job well. This does the whole job — inventory, risk, decarbonisation and disclosure, on one data model that agrees with itself.
The emissions ledger builds itself as data arrives — every activity accounted for, every mapping reviewable, nothing re-keyed by hand. The abatement and adaptation agents then turn that ledger into a priced, sequenced plan for getting to net zero, checked against your own target.
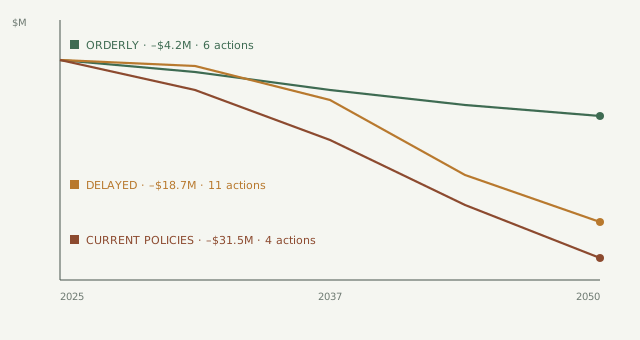
Transition risk is where most organisations are weakest — and where the financial consequence is largest. We model it properly: scenario by scenario, translated into plain financial impact, so a board can see exactly what’s at stake and what to do about it — not just a score on a heat-map.
The same agents that build your emissions inventory also model your risk and price your decarbonisation — so every number agrees with every other number.
Transition-risk agents run scenarios against policy, carbon price and demand shifts. Physical-risk agents draw on downscaled climate models for a sharper read on heat, flood, drought, wildfire and cyclone than a standard global model gives you. Both roll up from a single asset to a whole portfolio, with financial impact attached — not just an exposure score.
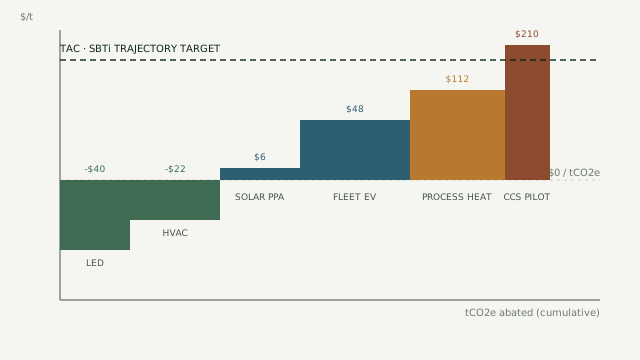
Scope 1, 2 and 3 accounting reconciles as data lands — no manual re-entry, no year-end scramble. The same ledger feeds a marginal abatement cost curve ranking every reduction lever you actually have, checked against your net-zero trajectory.
IFRS S2, CSRD/ESRS, TCFD and CDP filings assembled from the same data the inventory and risk agents already use — so the number in the filing and the number driving the decision are always the same figure.
Some collect and account. Some model risk and decarbonisation. Some report. All of them read and write to the same ledger.
Fetches data from any connected source — ERP, utility, spend, supplier — automatically.
Builds and reconciles the emissions inventory as data lands, to the GHG Protocol.
Transition scenario modelling, translated into financial impact and next steps.
Physical hazard exposure — heat, flood, drought, wildfire, cyclone — from downscaled climate models.
Ranks every decarbonisation lever you have by cost and impact.
Rolls risk up from one asset to an entire organisation or portfolio.
Drafts and maintains filings for IFRS S2, CSRD/ESRS, TCFD and CDP.
One data model, mapped forward into every regime you report against.
The same agent stack, tuned to the data your sector generates and the risk it actually carries.
Carbon accounting tools are strong on scope 1–3. Climate-risk tools are strong on exposure. Neither builds your inventory, models your risk with real climate science, prices your decarbonisation and drafts your disclosure — on one connected platform.
| Capability | Spreadsheets & consultants | Climate-risk analytics tools | Point carbon-accounting tools | Climate Action Platform |
|---|---|---|---|---|
| Data collection | Manual, chased by email | Not covered | Manual import | Automated, from any source |
| Scope 1–3 inventory | Manual, annual | Not covered | Core strength | Automated, continuous |
| Physical risk modelling | Outsourced, qualitative | Coarse, regional | Not covered | Downscaled climate models |
| Transition risk & scenarios | Outsourced study | Exposure score, not priced | Rarely covered | Modelled, priced, explained |
| Decarbonisation planning | One-off deliverable | Rarely covered | Rarely covered | Kept current as prices move |
| Disclosure drafting | Rebuilt each cycle | Not covered | Templated export | Generated from live data |
| Update cadence | Annual | At commission | Quarterly | Continuous |